|
Download Data (XLS File) |
|
|||||
|
|||||
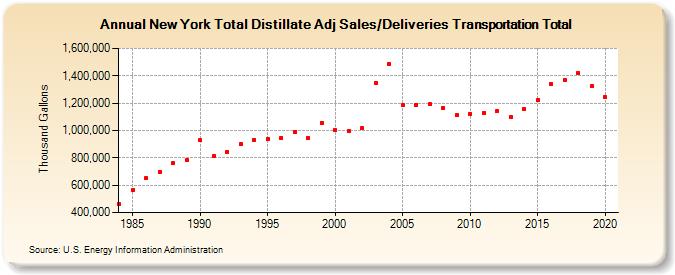
| New York Total Distillate Adj Sales/Deliveries Transportation Total (Thousand Gallons) | |||||
| Decade | Year-0 | Year-1 | Year-2 | Year-3 | Year-4 | Year-5 | Year-6 | Year-7 | Year-8 | Year-9 |
|---|---|---|---|---|---|---|---|---|---|---|
| 1980's | 460,026 | 564,521 | 649,758 | 700,063 | 762,099 | 781,785 | ||||
| 1990's | 928,011 | 812,312 | 845,858 | 900,861 | 930,921 | 937,454 | 945,705 | 991,989 | 945,385 | 1,057,404 |
| 2000's | 1,002,476 | 997,976 | 1,016,199 | 1,347,983 | 1,488,949 | 1,183,077 | 1,187,965 | 1,191,586 | 1,167,451 | 1,111,256 |
| 2010's | 1,123,229 | 1,129,780 | 1,139,594 | 1,095,957 | 1,158,770 | 1,221,280 | 1,338,406 | 1,368,560 | 1,419,015 | 1,322,762 |
| 2020's | 1,244,510 |
| - = No Data Reported; -- = Not Applicable; NA = Not Available; W = Withheld to avoid disclosure of individual company data. |
| Release Date: 2/9/2022 |
| Next Release Date: Suspended |