|
Download Data (XLS File) |
|
|||||
|
|||||
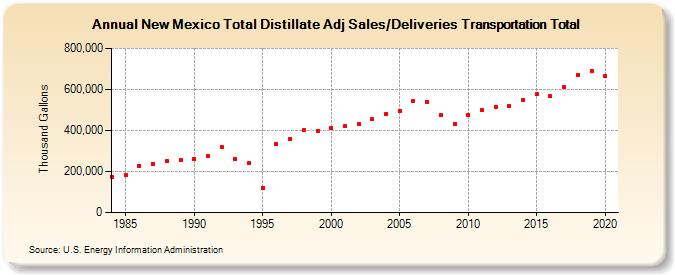
| New Mexico Total Distillate Adj Sales/Deliveries Transportation Total (Thousand Gallons) | |||||
| Decade | Year-0 | Year-1 | Year-2 | Year-3 | Year-4 | Year-5 | Year-6 | Year-7 | Year-8 | Year-9 |
|---|---|---|---|---|---|---|---|---|---|---|
| 1980's | 174,890 | 181,703 | 226,604 | 238,971 | 251,386 | 258,077 | ||||
| 1990's | 261,165 | 273,370 | 321,626 | 261,749 | 239,276 | 121,430 | 333,635 | 359,535 | 402,215 | 398,796 |
| 2000's | 409,884 | 421,087 | 429,840 | 455,030 | 480,279 | 493,504 | 542,059 | 539,403 | 476,155 | 433,102 |
| 2010's | 475,377 | 498,070 | 516,029 | 520,297 | 549,468 | 576,120 | 566,493 | 614,006 | 671,364 | 689,958 |
| 2020's | 666,102 |
| - = No Data Reported; -- = Not Applicable; NA = Not Available; W = Withheld to avoid disclosure of individual company data. |
| Release Date: 2/9/2022 |
| Next Release Date: Suspended |