|
Download Data (XLS File) |
|
|||||
|
|||||
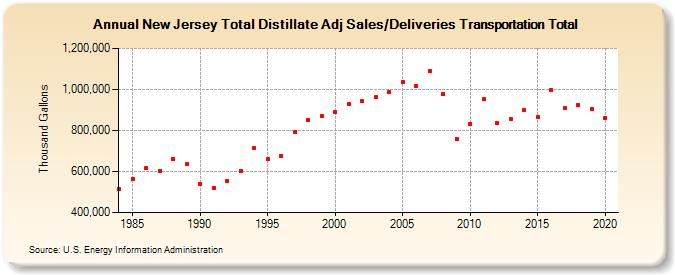
| New Jersey Total Distillate Adj Sales/Deliveries Transportation Total (Thousand Gallons) | |||||
| Decade | Year-0 | Year-1 | Year-2 | Year-3 | Year-4 | Year-5 | Year-6 | Year-7 | Year-8 | Year-9 |
|---|---|---|---|---|---|---|---|---|---|---|
| 1980's | 512,725 | 562,561 | 615,209 | 604,959 | 661,147 | 635,348 | ||||
| 1990's | 538,447 | 521,978 | 555,469 | 603,857 | 715,817 | 660,695 | 677,803 | 791,648 | 851,092 | 870,545 |
| 2000's | 890,692 | 929,423 | 942,008 | 961,119 | 986,169 | 1,038,071 | 1,017,560 | 1,088,505 | 978,515 | 760,035 |
| 2010's | 831,955 | 952,930 | 837,133 | 857,326 | 901,090 | 864,656 | 997,032 | 907,326 | 923,192 | 902,555 |
| 2020's | 861,822 |
| - = No Data Reported; -- = Not Applicable; NA = Not Available; W = Withheld to avoid disclosure of individual company data. |
| Release Date: 2/9/2022 |
| Next Release Date: Suspended |