|
Download Data (XLS File) |
|
|||||
|
|||||
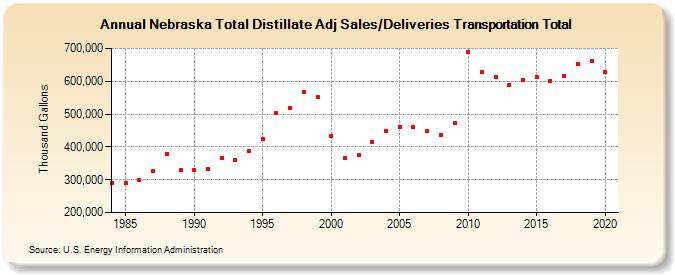
| Nebraska Total Distillate Adj Sales/Deliveries Transportation Total (Thousand Gallons) | |||||
| Decade | Year-0 | Year-1 | Year-2 | Year-3 | Year-4 | Year-5 | Year-6 | Year-7 | Year-8 | Year-9 |
|---|---|---|---|---|---|---|---|---|---|---|
| 1980's | 290,588 | 289,622 | 298,654 | 327,619 | 379,870 | 331,124 | ||||
| 1990's | 329,392 | 331,797 | 366,765 | 361,026 | 386,715 | 424,081 | 502,521 | 518,299 | 567,874 | 551,460 |
| 2000's | 432,908 | 367,579 | 376,336 | 415,356 | 449,494 | 459,924 | 459,672 | 448,098 | 435,444 | 472,303 |
| 2010's | 689,579 | 627,110 | 613,092 | 589,368 | 603,424 | 612,115 | 601,439 | 616,622 | 652,637 | 660,097 |
| 2020's | 627,990 |
| - = No Data Reported; -- = Not Applicable; NA = Not Available; W = Withheld to avoid disclosure of individual company data. |
| Release Date: 2/9/2022 |
| Next Release Date: Suspended |