|
Download Data (XLS File) |
|
|||||
|
|||||
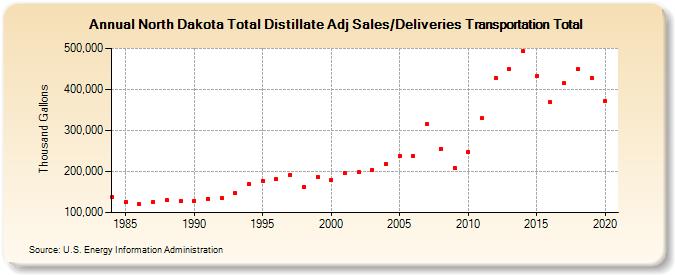
| North Dakota Total Distillate Adj Sales/Deliveries Transportation Total (Thousand Gallons) | |||||
| Decade | Year-0 | Year-1 | Year-2 | Year-3 | Year-4 | Year-5 | Year-6 | Year-7 | Year-8 | Year-9 |
|---|---|---|---|---|---|---|---|---|---|---|
| 1980's | 136,969 | 125,192 | 120,094 | 125,909 | 129,536 | 126,995 | ||||
| 1990's | 129,174 | 134,048 | 135,442 | 147,127 | 169,039 | 177,354 | 181,510 | 192,168 | 161,880 | 186,687 |
| 2000's | 179,714 | 196,673 | 198,423 | 204,481 | 218,480 | 237,577 | 238,060 | 314,776 | 255,906 | 209,401 |
| 2010's | 248,522 | 329,363 | 427,999 | 449,729 | 492,562 | 431,913 | 368,615 | 414,582 | 448,697 | 428,560 |
| 2020's | 370,829 |
| - = No Data Reported; -- = Not Applicable; NA = Not Available; W = Withheld to avoid disclosure of individual company data. |
| Release Date: 2/9/2022 |
| Next Release Date: Suspended |