|
Download Data (XLS File) |
|
|||||
|
|||||
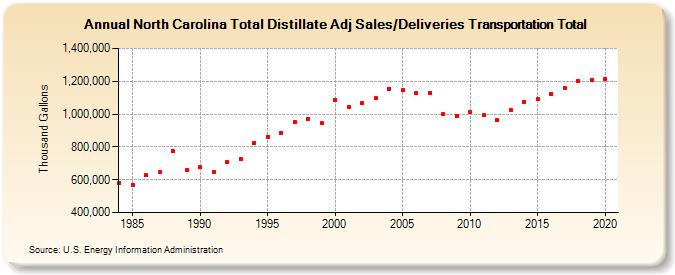
| North Carolina Total Distillate Adj Sales/Deliveries Transportation Total (Thousand Gallons) | |||||
| Decade | Year-0 | Year-1 | Year-2 | Year-3 | Year-4 | Year-5 | Year-6 | Year-7 | Year-8 | Year-9 |
|---|---|---|---|---|---|---|---|---|---|---|
| 1980's | 582,315 | 569,702 | 627,904 | 646,864 | 774,535 | 660,290 | ||||
| 1990's | 674,882 | 647,462 | 710,669 | 726,869 | 826,146 | 861,041 | 886,994 | 951,325 | 972,887 | 944,194 |
| 2000's | 1,085,060 | 1,045,544 | 1,068,390 | 1,097,315 | 1,155,491 | 1,145,871 | 1,125,986 | 1,130,749 | 1,000,226 | 988,097 |
| 2010's | 1,009,640 | 992,629 | 961,909 | 1,027,193 | 1,074,304 | 1,090,845 | 1,122,805 | 1,156,905 | 1,201,249 | 1,207,927 |
| 2020's | 1,215,464 |
| - = No Data Reported; -- = Not Applicable; NA = Not Available; W = Withheld to avoid disclosure of individual company data. |
| Release Date: 2/9/2022 |
| Next Release Date: Suspended |