|
Download Data (XLS File) |
|
|||||
|
|||||
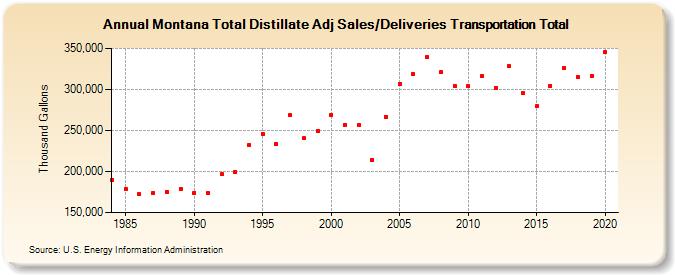
| Montana Total Distillate Adj Sales/Deliveries Transportation Total (Thousand Gallons) | |||||
| Decade | Year-0 | Year-1 | Year-2 | Year-3 | Year-4 | Year-5 | Year-6 | Year-7 | Year-8 | Year-9 |
|---|---|---|---|---|---|---|---|---|---|---|
| 1980's | 189,529 | 179,094 | 172,016 | 174,171 | 175,539 | 178,786 | ||||
| 1990's | 174,232 | 174,351 | 196,389 | 199,166 | 232,530 | 245,842 | 233,789 | 268,391 | 240,414 | 249,737 |
| 2000's | 268,554 | 257,103 | 256,202 | 214,334 | 266,776 | 306,966 | 318,630 | 339,377 | 320,775 | 303,914 |
| 2010's | 303,878 | 316,208 | 302,165 | 328,157 | 295,493 | 279,381 | 304,763 | 326,225 | 314,952 | 316,758 |
| 2020's | 345,679 |
| - = No Data Reported; -- = Not Applicable; NA = Not Available; W = Withheld to avoid disclosure of individual company data. |
| Release Date: 2/9/2022 |
| Next Release Date: Suspended |