|
Download Data (XLS File) |
|
|||||
|
|||||
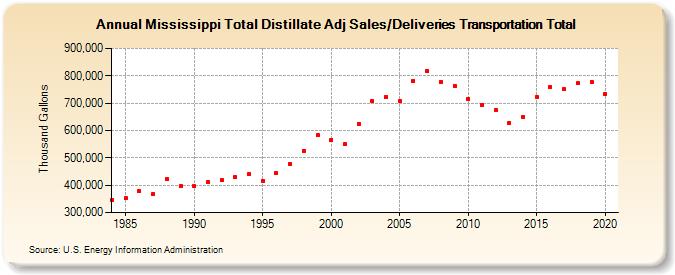
| Mississippi Total Distillate Adj Sales/Deliveries Transportation Total (Thousand Gallons) | |||||
| Decade | Year-0 | Year-1 | Year-2 | Year-3 | Year-4 | Year-5 | Year-6 | Year-7 | Year-8 | Year-9 |
|---|---|---|---|---|---|---|---|---|---|---|
| 1980's | 344,615 | 351,513 | 377,646 | 367,155 | 423,013 | 396,327 | ||||
| 1990's | 396,027 | 411,215 | 418,936 | 428,874 | 440,189 | 416,509 | 444,304 | 479,233 | 526,795 | 582,781 |
| 2000's | 566,402 | 549,751 | 625,316 | 706,849 | 723,260 | 707,283 | 781,725 | 817,080 | 777,476 | 762,866 |
| 2010's | 716,078 | 691,855 | 675,195 | 628,437 | 649,282 | 723,830 | 758,453 | 750,289 | 772,091 | 778,549 |
| 2020's | 733,411 |
| - = No Data Reported; -- = Not Applicable; NA = Not Available; W = Withheld to avoid disclosure of individual company data. |
| Release Date: 2/9/2022 |
| Next Release Date: Suspended |