|
Download Data (XLS File) |
|
|||||
|
|||||
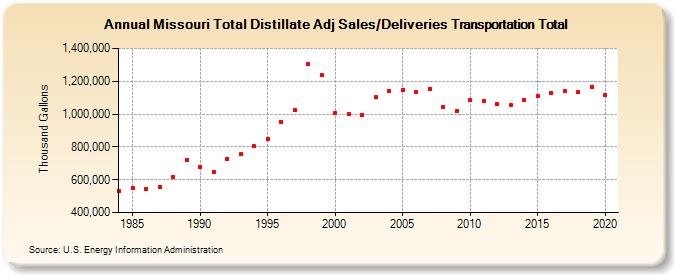
| Missouri Total Distillate Adj Sales/Deliveries Transportation Total (Thousand Gallons) | |||||
| Decade | Year-0 | Year-1 | Year-2 | Year-3 | Year-4 | Year-5 | Year-6 | Year-7 | Year-8 | Year-9 |
|---|---|---|---|---|---|---|---|---|---|---|
| 1980's | 531,162 | 549,985 | 545,389 | 556,239 | 617,711 | 720,556 | ||||
| 1990's | 678,131 | 648,790 | 728,328 | 754,722 | 803,436 | 848,110 | 953,586 | 1,023,900 | 1,303,819 | 1,236,049 |
| 2000's | 1,008,728 | 999,146 | 996,890 | 1,101,678 | 1,143,457 | 1,143,543 | 1,134,664 | 1,154,983 | 1,044,694 | 1,018,661 |
| 2010's | 1,083,564 | 1,076,800 | 1,058,235 | 1,057,608 | 1,087,809 | 1,111,289 | 1,130,679 | 1,137,495 | 1,133,069 | 1,165,771 |
| 2020's | 1,115,589 |
| - = No Data Reported; -- = Not Applicable; NA = Not Available; W = Withheld to avoid disclosure of individual company data. |
| Release Date: 2/9/2022 |
| Next Release Date: Suspended |