|
Download Data (XLS File) |
|
|||||
|
|||||
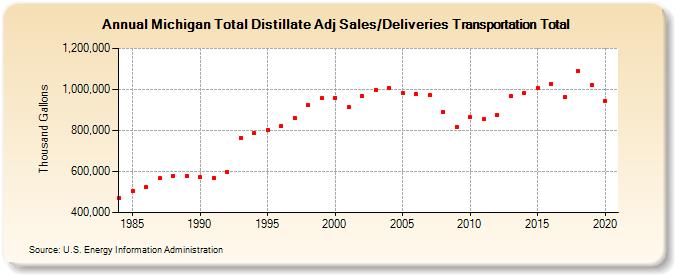
| Michigan Total Distillate Adj Sales/Deliveries Transportation Total (Thousand Gallons) | |||||
| Decade | Year-0 | Year-1 | Year-2 | Year-3 | Year-4 | Year-5 | Year-6 | Year-7 | Year-8 | Year-9 |
|---|---|---|---|---|---|---|---|---|---|---|
| 1980's | 470,239 | 503,237 | 524,359 | 566,767 | 580,147 | 576,148 | ||||
| 1990's | 571,137 | 570,601 | 597,739 | 764,734 | 788,663 | 801,964 | 820,641 | 862,954 | 924,674 | 956,525 |
| 2000's | 959,787 | 913,541 | 968,368 | 999,293 | 1,008,562 | 981,016 | 977,713 | 970,806 | 891,487 | 819,086 |
| 2010's | 864,049 | 854,644 | 877,663 | 966,433 | 982,936 | 1,007,212 | 1,027,959 | 962,529 | 1,090,599 | 1,023,754 |
| 2020's | 944,181 |
| - = No Data Reported; -- = Not Applicable; NA = Not Available; W = Withheld to avoid disclosure of individual company data. |
| Release Date: 2/9/2022 |
| Next Release Date: Suspended |