|
Download Data (XLS File) |
|
|||||
|
|||||
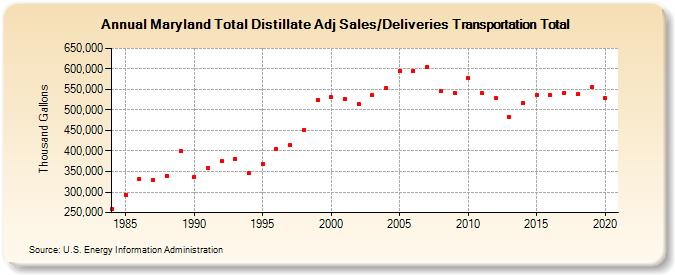
| Maryland Total Distillate Adj Sales/Deliveries Transportation Total (Thousand Gallons) | |||||
| Decade | Year-0 | Year-1 | Year-2 | Year-3 | Year-4 | Year-5 | Year-6 | Year-7 | Year-8 | Year-9 |
|---|---|---|---|---|---|---|---|---|---|---|
| 1980's | 257,779 | 293,967 | 332,936 | 328,839 | 340,112 | 400,884 | ||||
| 1990's | 336,990 | 358,025 | 376,105 | 381,183 | 346,253 | 368,811 | 404,028 | 413,663 | 451,394 | 524,345 |
| 2000's | 530,696 | 526,361 | 514,222 | 536,762 | 552,955 | 594,763 | 596,095 | 605,164 | 545,625 | 542,007 |
| 2010's | 578,264 | 541,532 | 529,309 | 483,433 | 518,076 | 537,589 | 536,794 | 541,920 | 539,432 | 554,849 |
| 2020's | 530,204 |
| - = No Data Reported; -- = Not Applicable; NA = Not Available; W = Withheld to avoid disclosure of individual company data. |
| Release Date: 2/9/2022 |
| Next Release Date: Suspended |