|
Download Data (XLS File) |
|
|||||
|
|||||
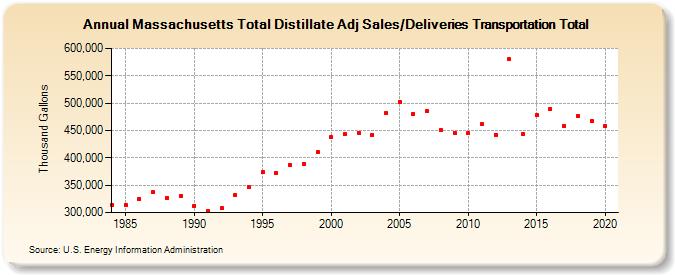
| Massachusetts Total Distillate Adj Sales/Deliveries Transportation Total (Thousand Gallons) | |||||
| Decade | Year-0 | Year-1 | Year-2 | Year-3 | Year-4 | Year-5 | Year-6 | Year-7 | Year-8 | Year-9 |
|---|---|---|---|---|---|---|---|---|---|---|
| 1980's | 314,634 | 314,373 | 325,022 | 336,894 | 327,113 | 329,919 | ||||
| 1990's | 312,621 | 302,620 | 307,898 | 332,279 | 345,921 | 373,329 | 372,398 | 387,271 | 388,806 | 410,331 |
| 2000's | 437,481 | 443,656 | 445,945 | 442,350 | 482,019 | 501,985 | 480,806 | 485,059 | 450,616 | 446,088 |
| 2010's | 444,522 | 461,035 | 442,310 | 579,773 | 442,876 | 477,909 | 489,200 | 457,740 | 476,962 | 467,596 |
| 2020's | 458,424 |
| - = No Data Reported; -- = Not Applicable; NA = Not Available; W = Withheld to avoid disclosure of individual company data. |
| Release Date: 2/9/2022 |
| Next Release Date: Suspended |