|
Download Data (XLS File) |
|
|||||
|
|||||
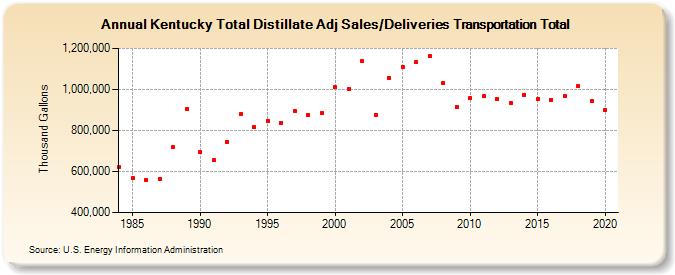
| Kentucky Total Distillate Adj Sales/Deliveries Transportation Total (Thousand Gallons) | |||||
| Decade | Year-0 | Year-1 | Year-2 | Year-3 | Year-4 | Year-5 | Year-6 | Year-7 | Year-8 | Year-9 |
|---|---|---|---|---|---|---|---|---|---|---|
| 1980's | 623,121 | 569,456 | 560,449 | 563,508 | 720,122 | 906,831 | ||||
| 1990's | 693,874 | 656,281 | 744,924 | 879,083 | 816,116 | 848,275 | 838,189 | 895,560 | 877,221 | 883,988 |
| 2000's | 1,010,082 | 1,003,359 | 1,137,131 | 877,595 | 1,057,023 | 1,108,794 | 1,131,920 | 1,162,835 | 1,032,225 | 914,038 |
| 2010's | 958,385 | 966,723 | 953,163 | 935,555 | 974,389 | 953,240 | 949,068 | 965,562 | 1,014,588 | 945,561 |
| 2020's | 902,143 |
| - = No Data Reported; -- = Not Applicable; NA = Not Available; W = Withheld to avoid disclosure of individual company data. |
| Release Date: 2/9/2022 |
| Next Release Date: Suspended |