|
Download Data (XLS File) |
|
|||||
|
|||||
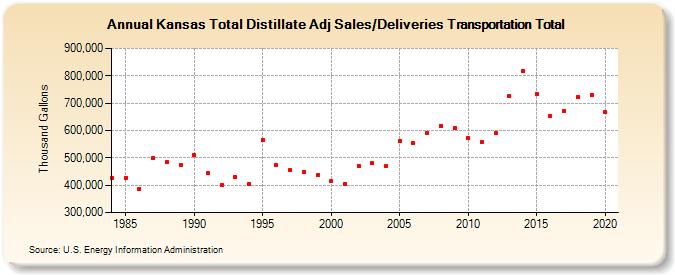
| Kansas Total Distillate Adj Sales/Deliveries Transportation Total (Thousand Gallons) | |||||
| Decade | Year-0 | Year-1 | Year-2 | Year-3 | Year-4 | Year-5 | Year-6 | Year-7 | Year-8 | Year-9 |
|---|---|---|---|---|---|---|---|---|---|---|
| 1980's | 427,205 | 427,960 | 386,126 | 499,969 | 483,276 | 473,821 | ||||
| 1990's | 509,659 | 442,796 | 399,847 | 431,267 | 403,355 | 565,095 | 474,635 | 454,868 | 448,645 | 435,866 |
| 2000's | 413,992 | 403,199 | 471,210 | 480,546 | 470,254 | 561,884 | 555,829 | 591,125 | 618,065 | 608,674 |
| 2010's | 572,562 | 558,750 | 591,201 | 724,623 | 816,178 | 734,516 | 653,645 | 671,688 | 723,339 | 731,223 |
| 2020's | 667,514 |
| - = No Data Reported; -- = Not Applicable; NA = Not Available; W = Withheld to avoid disclosure of individual company data. |
| Release Date: 2/9/2022 |
| Next Release Date: Suspended |