|
Download Data (XLS File) |
|
|||||
|
|||||
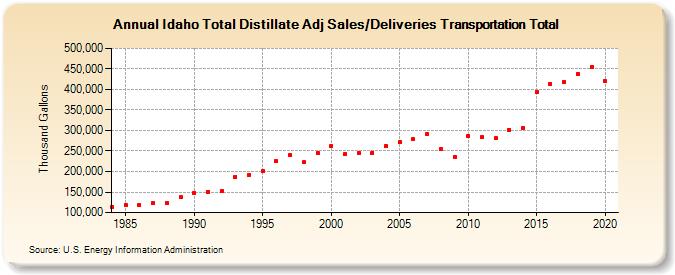
| Idaho Total Distillate Adj Sales/Deliveries Transportation Total (Thousand Gallons) | |||||
| Decade | Year-0 | Year-1 | Year-2 | Year-3 | Year-4 | Year-5 | Year-6 | Year-7 | Year-8 | Year-9 |
|---|---|---|---|---|---|---|---|---|---|---|
| 1980's | 113,751 | 117,927 | 118,367 | 123,000 | 123,488 | 137,044 | ||||
| 1990's | 147,901 | 151,134 | 152,430 | 186,834 | 191,140 | 200,392 | 226,043 | 240,263 | 222,094 | 244,720 |
| 2000's | 262,234 | 242,133 | 246,012 | 246,300 | 262,157 | 270,936 | 278,269 | 290,528 | 254,790 | 235,367 |
| 2010's | 286,625 | 283,809 | 281,403 | 302,027 | 305,486 | 394,568 | 414,298 | 417,968 | 438,224 | 454,124 |
| 2020's | 419,648 |
| - = No Data Reported; -- = Not Applicable; NA = Not Available; W = Withheld to avoid disclosure of individual company data. |
| Release Date: 2/9/2022 |
| Next Release Date: Suspended |