|
Download Data (XLS File) |
|
|||||
|
|||||
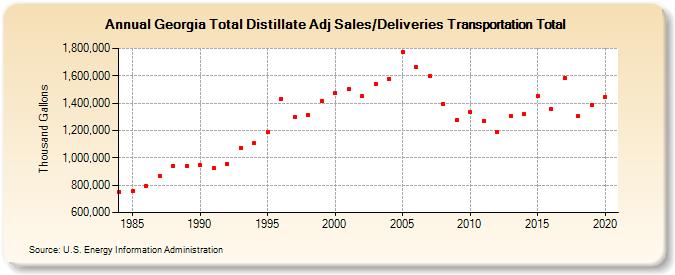
| Georgia Total Distillate Adj Sales/Deliveries Transportation Total (Thousand Gallons) | |||||
| Decade | Year-0 | Year-1 | Year-2 | Year-3 | Year-4 | Year-5 | Year-6 | Year-7 | Year-8 | Year-9 |
|---|---|---|---|---|---|---|---|---|---|---|
| 1980's | 752,112 | 755,711 | 795,275 | 869,991 | 943,002 | 939,668 | ||||
| 1990's | 945,943 | 926,418 | 958,031 | 1,074,659 | 1,105,139 | 1,188,063 | 1,432,995 | 1,298,041 | 1,315,736 | 1,413,842 |
| 2000's | 1,473,207 | 1,500,917 | 1,449,311 | 1,542,288 | 1,577,886 | 1,772,934 | 1,660,715 | 1,598,006 | 1,393,526 | 1,274,140 |
| 2010's | 1,335,675 | 1,272,781 | 1,189,806 | 1,303,377 | 1,323,363 | 1,452,380 | 1,355,235 | 1,582,854 | 1,305,567 | 1,388,772 |
| 2020's | 1,446,811 |
| - = No Data Reported; -- = Not Applicable; NA = Not Available; W = Withheld to avoid disclosure of individual company data. |
| Release Date: 2/9/2022 |
| Next Release Date: Suspended |