|
Download Data (XLS File) |
|
|||||
|
|||||
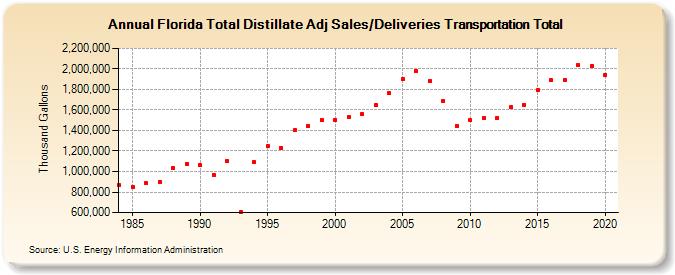
| Florida Total Distillate Adj Sales/Deliveries Transportation Total (Thousand Gallons) | |||||
| Decade | Year-0 | Year-1 | Year-2 | Year-3 | Year-4 | Year-5 | Year-6 | Year-7 | Year-8 | Year-9 |
|---|---|---|---|---|---|---|---|---|---|---|
| 1980's | 866,430 | 847,947 | 885,030 | 900,965 | 1,036,118 | 1,074,554 | ||||
| 1990's | 1,062,470 | 968,802 | 1,098,437 | 607,507 | 1,090,911 | 1,244,517 | 1,232,520 | 1,399,891 | 1,444,082 | 1,506,500 |
| 2000's | 1,505,594 | 1,529,797 | 1,559,463 | 1,648,204 | 1,760,596 | 1,901,045 | 1,977,753 | 1,882,991 | 1,687,172 | 1,447,707 |
| 2010's | 1,498,322 | 1,521,309 | 1,521,723 | 1,625,570 | 1,651,832 | 1,790,357 | 1,889,055 | 1,889,513 | 2,039,723 | 2,030,371 |
| 2020's | 1,940,667 |
| - = No Data Reported; -- = Not Applicable; NA = Not Available; W = Withheld to avoid disclosure of individual company data. |
| Release Date: 2/9/2022 |
| Next Release Date: Suspended |