|
Download Data (XLS File) |
|
|||||
|
|||||
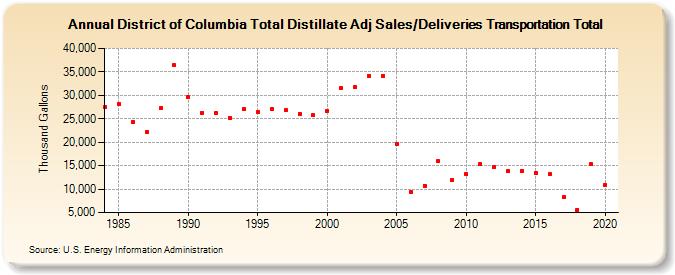
| District of Columbia Total Distillate Adj Sales/Deliveries Transportation Total (Thousand Gallons) | |||||
| Decade | Year-0 | Year-1 | Year-2 | Year-3 | Year-4 | Year-5 | Year-6 | Year-7 | Year-8 | Year-9 |
|---|---|---|---|---|---|---|---|---|---|---|
| 1980's | 27,427 | 28,151 | 24,289 | 22,254 | 27,192 | 36,373 | ||||
| 1990's | 29,551 | 26,324 | 26,176 | 25,199 | 27,028 | 26,518 | 27,112 | 26,772 | 25,967 | 25,710 |
| 2000's | 26,728 | 31,510 | 31,667 | 34,191 | 34,181 | 19,625 | 9,464 | 10,720 | 15,893 | 11,949 |
| 2010's | 13,189 | 15,262 | 14,739 | 13,842 | 13,964 | 13,491 | 13,151 | 8,265 | 5,635 | 15,299 |
| 2020's | 10,877 |
| - = No Data Reported; -- = Not Applicable; NA = Not Available; W = Withheld to avoid disclosure of individual company data. |
| Release Date: 2/9/2022 |
| Next Release Date: Suspended |