|
Download Data (XLS File) |
|
|||||
|
|||||
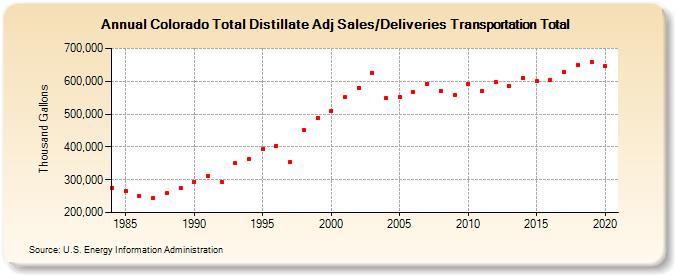
| Colorado Total Distillate Adj Sales/Deliveries Transportation Total (Thousand Gallons) | |||||
| Decade | Year-0 | Year-1 | Year-2 | Year-3 | Year-4 | Year-5 | Year-6 | Year-7 | Year-8 | Year-9 |
|---|---|---|---|---|---|---|---|---|---|---|
| 1980's | 274,109 | 264,814 | 249,781 | 244,450 | 259,015 | 274,193 | ||||
| 1990's | 294,513 | 311,724 | 293,237 | 350,098 | 363,222 | 392,276 | 403,868 | 353,169 | 451,548 | 488,598 |
| 2000's | 510,288 | 550,459 | 580,559 | 626,456 | 548,145 | 551,596 | 568,629 | 591,731 | 570,529 | 558,270 |
| 2010's | 591,470 | 571,216 | 596,139 | 584,978 | 609,179 | 599,517 | 604,021 | 629,298 | 650,481 | 659,672 |
| 2020's | 645,905 |
| - = No Data Reported; -- = Not Applicable; NA = Not Available; W = Withheld to avoid disclosure of individual company data. |
| Release Date: 2/9/2022 |
| Next Release Date: Suspended |