|
Download Data (XLS File) |
|
|||||
|
|||||
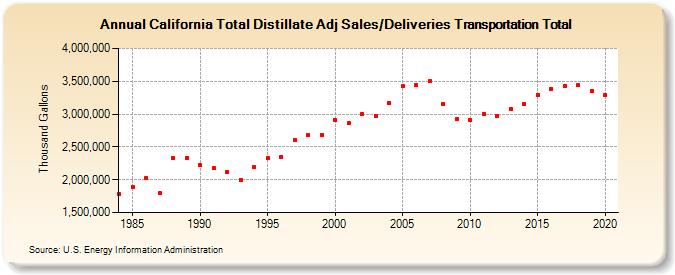
| California Total Distillate Adj Sales/Deliveries Transportation Total (Thousand Gallons) | |||||
| Decade | Year-0 | Year-1 | Year-2 | Year-3 | Year-4 | Year-5 | Year-6 | Year-7 | Year-8 | Year-9 |
|---|---|---|---|---|---|---|---|---|---|---|
| 1980's | 1,782,361 | 1,883,202 | 2,029,655 | 1,794,999 | 2,324,693 | 2,330,870 | ||||
| 1990's | 2,219,724 | 2,176,873 | 2,122,429 | 2,002,700 | 2,192,299 | 2,328,844 | 2,347,836 | 2,602,164 | 2,675,732 | 2,683,779 |
| 2000's | 2,913,260 | 2,863,373 | 3,004,320 | 2,977,535 | 3,170,488 | 3,423,095 | 3,439,581 | 3,502,671 | 3,149,158 | 2,923,376 |
| 2010's | 2,913,524 | 3,007,321 | 2,963,586 | 3,072,256 | 3,159,318 | 3,297,072 | 3,383,112 | 3,429,316 | 3,435,746 | 3,349,479 |
| 2020's | 3,297,421 |
| - = No Data Reported; -- = Not Applicable; NA = Not Available; W = Withheld to avoid disclosure of individual company data. |
| Release Date: 2/9/2022 |
| Next Release Date: Suspended |