|
Download Data (XLS File) |
|
|||||
|
|||||
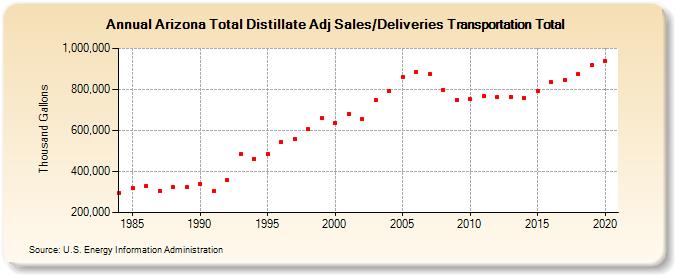
| Arizona Total Distillate Adj Sales/Deliveries Transportation Total (Thousand Gallons) | |||||
| Decade | Year-0 | Year-1 | Year-2 | Year-3 | Year-4 | Year-5 | Year-6 | Year-7 | Year-8 | Year-9 |
|---|---|---|---|---|---|---|---|---|---|---|
| 1980's | 297,016 | 320,252 | 329,787 | 306,465 | 323,762 | 323,019 | ||||
| 1990's | 341,455 | 305,074 | 357,598 | 484,362 | 461,129 | 486,442 | 546,119 | 560,243 | 605,366 | 662,912 |
| 2000's | 634,083 | 680,876 | 655,492 | 747,625 | 791,402 | 858,331 | 885,329 | 877,174 | 799,123 | 746,952 |
| 2010's | 751,025 | 767,565 | 761,947 | 765,149 | 759,042 | 791,360 | 835,688 | 847,961 | 873,121 | 918,491 |
| 2020's | 938,082 |
| - = No Data Reported; -- = Not Applicable; NA = Not Available; W = Withheld to avoid disclosure of individual company data. |
| Release Date: 2/9/2022 |
| Next Release Date: Suspended |