|
Download Data (XLS File) |
|
|||||
|
|||||
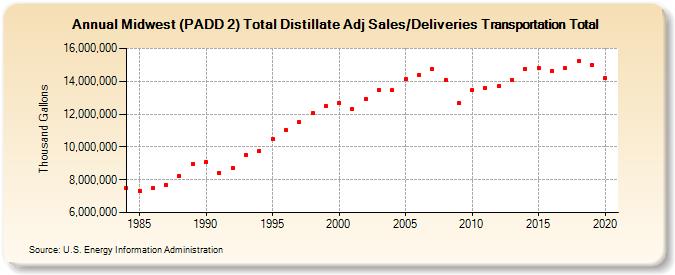
| Midwest (PADD 2) Total Distillate Adj Sales/Deliveries Transportation Total (Thousand Gallons) | |||||
| Decade | Year-0 | Year-1 | Year-2 | Year-3 | Year-4 | Year-5 | Year-6 | Year-7 | Year-8 | Year-9 |
|---|---|---|---|---|---|---|---|---|---|---|
| 1980's | 7,486,738 | 7,334,006 | 7,493,806 | 7,706,708 | 8,237,861 | 8,970,104 | ||||
| 1990's | 9,090,909 | 8,429,879 | 8,737,653 | 9,512,624 | 9,742,752 | 10,468,875 | 11,014,552 | 11,493,148 | 12,040,245 | 12,481,273 |
| 2000's | 12,659,010 | 12,318,350 | 12,922,006 | 13,464,258 | 13,454,277 | 14,115,771 | 14,405,294 | 14,769,736 | 14,086,567 | 12,647,019 |
| 2010's | 13,474,639 | 13,600,746 | 13,704,362 | 14,064,069 | 14,746,517 | 14,808,955 | 14,593,460 | 14,786,170 | 15,232,755 | 14,997,987 |
| 2020's | 14,200,413 |
| - = No Data Reported; -- = Not Applicable; NA = Not Available; W = Withheld to avoid disclosure of individual company data. |
| Release Date: 2/9/2022 |
| Next Release Date: Suspended |