|
Download Data (XLS File) |
|
|||||
|
|||||
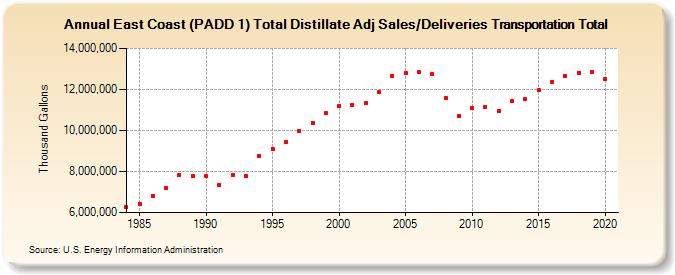
| East Coast (PADD 1) Total Distillate Adj Sales/Deliveries Transportation Total (Thousand Gallons) | |||||
| Decade | Year-0 | Year-1 | Year-2 | Year-3 | Year-4 | Year-5 | Year-6 | Year-7 | Year-8 | Year-9 |
|---|---|---|---|---|---|---|---|---|---|---|
| 1980's | 6,263,359 | 6,441,049 | 6,822,924 | 7,179,381 | 7,829,562 | 7,761,330 | ||||
| 1990's | 7,766,021 | 7,333,760 | 7,853,850 | 7,802,729 | 8,770,437 | 9,116,408 | 9,453,967 | 9,992,369 | 10,384,703 | 10,858,658 |
| 2000's | 11,205,474 | 11,253,265 | 11,330,050 | 11,865,524 | 12,644,406 | 12,796,031 | 12,834,887 | 12,751,805 | 11,580,705 | 10,705,977 |
| 2010's | 11,093,408 | 11,158,584 | 10,966,549 | 11,437,042 | 11,515,648 | 11,952,898 | 12,378,733 | 12,656,370 | 12,819,281 | 12,854,757 |
| 2020's | 12,497,730 |
| - = No Data Reported; -- = Not Applicable; NA = Not Available; W = Withheld to avoid disclosure of individual company data. |
| Release Date: 2/9/2022 |
| Next Release Date: Suspended |