|
Download Data (XLS File) |
|
|||||
|
|||||
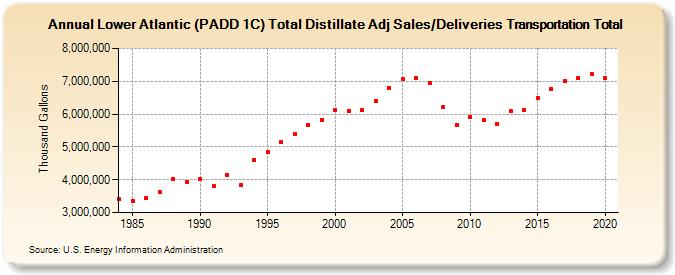
| Lower Atlantic (PADD 1C) Total Distillate Adj Sales/Deliveries Transportation Total (Thousand Gallons) | |||||
| Decade | Year-0 | Year-1 | Year-2 | Year-3 | Year-4 | Year-5 | Year-6 | Year-7 | Year-8 | Year-9 |
|---|---|---|---|---|---|---|---|---|---|---|
| 1980's | 3,399,010 | 3,361,696 | 3,439,676 | 3,621,237 | 4,036,602 | 3,920,506 | ||||
| 1990's | 4,030,511 | 3,811,772 | 4,151,381 | 3,830,191 | 4,601,561 | 4,841,714 | 5,153,645 | 5,398,370 | 5,669,561 | 5,833,026 |
| 2000's | 6,130,312 | 6,090,672 | 6,122,810 | 6,395,927 | 6,794,266 | 7,058,212 | 7,099,037 | 6,940,975 | 6,200,845 | 5,667,615 |
| 2010's | 5,902,292 | 5,810,461 | 5,683,400 | 6,089,565 | 6,129,066 | 6,497,828 | 6,754,331 | 6,995,571 | 7,110,599 | 7,222,114 |
| 2020's | 7,098,230 |
| - = No Data Reported; -- = Not Applicable; NA = Not Available; W = Withheld to avoid disclosure of individual company data. |
| Release Date: 2/9/2022 |
| Next Release Date: Suspended |