|
Download Data (XLS File) |
|
|||||
|
|||||
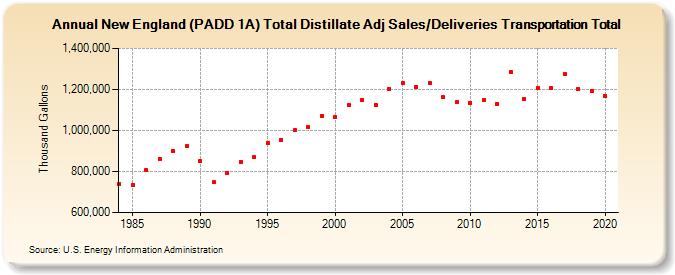
| New England (PADD 1A) Total Distillate Adj Sales/Deliveries Transportation Total (Thousand Gallons) | |||||
| Decade | Year-0 | Year-1 | Year-2 | Year-3 | Year-4 | Year-5 | Year-6 | Year-7 | Year-8 | Year-9 |
|---|---|---|---|---|---|---|---|---|---|---|
| 1980's | 740,909 | 734,729 | 806,743 | 863,301 | 901,850 | 922,334 | ||||
| 1990's | 848,935 | 747,391 | 794,141 | 846,542 | 868,493 | 939,588 | 955,181 | 1,000,029 | 1,018,103 | 1,072,933 |
| 2000's | 1,063,501 | 1,122,860 | 1,150,930 | 1,126,335 | 1,201,838 | 1,229,664 | 1,212,633 | 1,232,167 | 1,161,604 | 1,138,064 |
| 2010's | 1,135,610 | 1,149,697 | 1,129,951 | 1,286,103 | 1,155,522 | 1,208,859 | 1,206,163 | 1,272,824 | 1,204,330 | 1,193,255 |
| 2020's | 1,169,721 |
| - = No Data Reported; -- = Not Applicable; NA = Not Available; W = Withheld to avoid disclosure of individual company data. |
| Release Date: 2/9/2022 |
| Next Release Date: Suspended |