|
Download Data (XLS File) |
|
|||||
|
|||||
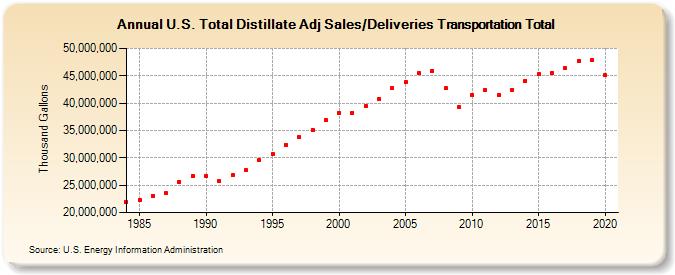
| U.S. Total Distillate Adj Sales/Deliveries Transportation Total (Thousand Gallons) | |||||
| Decade | Year-0 | Year-1 | Year-2 | Year-3 | Year-4 | Year-5 | Year-6 | Year-7 | Year-8 | Year-9 |
|---|---|---|---|---|---|---|---|---|---|---|
| 1980's | 21,946,383 | 22,383,644 | 23,060,339 | 23,543,853 | 25,608,308 | 26,752,365 | ||||
| 1990's | 26,767,592 | 25,679,295 | 26,832,273 | 27,709,584 | 29,532,949 | 30,745,561 | 32,403,137 | 33,788,983 | 35,109,034 | 36,916,963 |
| 2000's | 38,197,244 | 38,273,146 | 39,426,630 | 40,842,147 | 42,740,897 | 43,848,085 | 45,448,186 | 45,895,115 | 42,715,635 | 39,316,564 |
| 2010's | 41,432,363 | 42,410,677 | 41,511,855 | 42,485,770 | 44,046,745 | 45,247,263 | 45,581,663 | 46,357,718 | 47,759,382 | 47,844,605 |
| 2020's | 45,086,223 |
| - = No Data Reported; -- = Not Applicable; NA = Not Available; W = Withheld to avoid disclosure of individual company data. |
| Release Date: 2/9/2022 |
| Next Release Date: Suspended |