|
Download Data (XLS File) |
|
|||||
|
|||||
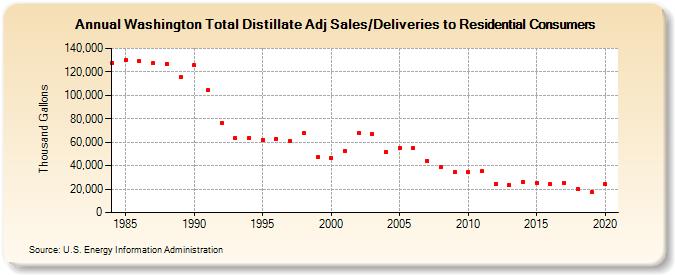
| Washington Total Distillate Adj Sales/Deliveries to Residential Consumers (Thousand Gallons) | |||||
| Decade | Year-0 | Year-1 | Year-2 | Year-3 | Year-4 | Year-5 | Year-6 | Year-7 | Year-8 | Year-9 |
|---|---|---|---|---|---|---|---|---|---|---|
| 1980's | 127,690 | 130,306 | 128,928 | 127,228 | 127,023 | 115,235 | ||||
| 1990's | 125,593 | 104,214 | 76,779 | 63,668 | 63,867 | 62,151 | 63,006 | 61,102 | 68,008 | 46,993 |
| 2000's | 46,866 | 52,779 | 67,447 | 67,000 | 51,978 | 54,873 | 54,842 | 44,304 | 38,803 | 34,237 |
| 2010's | 34,182 | 35,166 | 24,541 | 23,467 | 26,053 | 25,501 | 24,282 | 25,546 | 20,104 | 17,165 |
| 2020's | 24,116 |
| - = No Data Reported; -- = Not Applicable; NA = Not Available; W = Withheld to avoid disclosure of individual company data. |
| Release Date: 2/9/2022 |
| Next Release Date: Suspended |