|
Download Data (XLS File) |
|
|||||
|
|||||
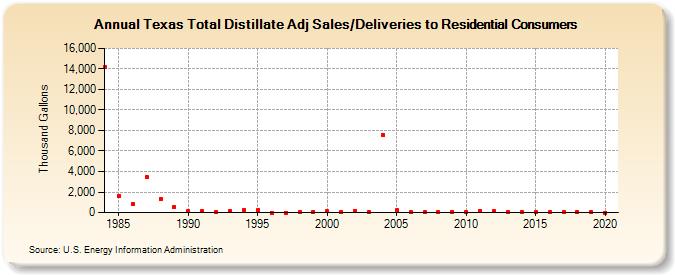
| Texas Total Distillate Adj Sales/Deliveries to Residential Consumers (Thousand Gallons) | |||||
| Decade | Year-0 | Year-1 | Year-2 | Year-3 | Year-4 | Year-5 | Year-6 | Year-7 | Year-8 | Year-9 |
|---|---|---|---|---|---|---|---|---|---|---|
| 1980's | 14,185 | 1,634 | 867 | 3,441 | 1,334 | 539 | ||||
| 1990's | 110 | 138 | 95 | 139 | 256 | 217 | 3 | 5 | 8 | 87 |
| 2000's | 121 | 46 | 186 | 10 | 7,559 | 220 | 17 | 15 | 16 | 85 |
| 2010's | 39 | 184 | 113 | 15 | 58 | 67 | 37 | 32 | 45 | 46 |
| 2020's | 1 |
| - = No Data Reported; -- = Not Applicable; NA = Not Available; W = Withheld to avoid disclosure of individual company data. |
| Release Date: 2/9/2022 |
| Next Release Date: Suspended |