|
Download Data (XLS File) |
|
|||||
|
|||||
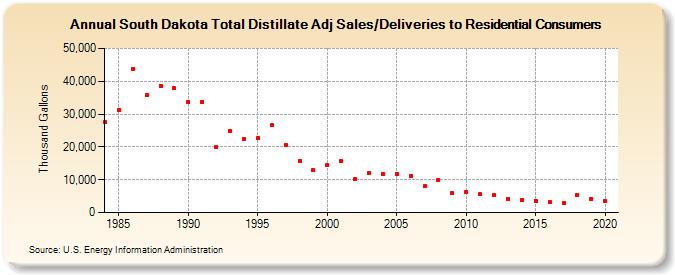
| South Dakota Total Distillate Adj Sales/Deliveries to Residential Consumers (Thousand Gallons) | |||||
| Decade | Year-0 | Year-1 | Year-2 | Year-3 | Year-4 | Year-5 | Year-6 | Year-7 | Year-8 | Year-9 |
|---|---|---|---|---|---|---|---|---|---|---|
| 1980's | 27,526 | 31,283 | 43,684 | 35,955 | 38,625 | 37,803 | ||||
| 1990's | 33,745 | 33,741 | 19,908 | 24,841 | 22,486 | 22,775 | 26,546 | 20,585 | 15,802 | 12,856 |
| 2000's | 14,392 | 15,564 | 10,292 | 12,147 | 11,818 | 11,599 | 11,208 | 8,020 | 9,943 | 5,838 |
| 2010's | 6,348 | 5,512 | 5,313 | 4,280 | 3,955 | 3,650 | 3,144 | 2,900 | 5,290 | 4,224 |
| 2020's | 3,414 |
| - = No Data Reported; -- = Not Applicable; NA = Not Available; W = Withheld to avoid disclosure of individual company data. |
| Release Date: 2/9/2022 |
| Next Release Date: Suspended |