|
Download Data (XLS File) |
|
|||||
|
|||||
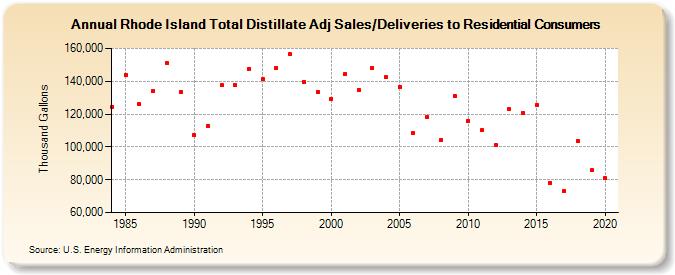
| Rhode Island Total Distillate Adj Sales/Deliveries to Residential Consumers (Thousand Gallons) | |||||
| Decade | Year-0 | Year-1 | Year-2 | Year-3 | Year-4 | Year-5 | Year-6 | Year-7 | Year-8 | Year-9 |
|---|---|---|---|---|---|---|---|---|---|---|
| 1980's | 124,455 | 143,918 | 125,898 | 134,202 | 151,241 | 133,478 | ||||
| 1990's | 107,008 | 112,854 | 137,407 | 137,652 | 147,504 | 141,080 | 148,306 | 156,304 | 139,718 | 133,476 |
| 2000's | 129,246 | 144,259 | 134,781 | 148,246 | 142,291 | 136,618 | 108,228 | 118,204 | 103,907 | 131,042 |
| 2010's | 115,928 | 110,015 | 101,063 | 122,853 | 120,736 | 125,708 | 78,189 | 72,877 | 103,539 | 85,870 |
| 2020's | 80,889 |
| - = No Data Reported; -- = Not Applicable; NA = Not Available; W = Withheld to avoid disclosure of individual company data. |
| Release Date: 2/9/2022 |
| Next Release Date: Suspended |