|
Download Data (XLS File) |
|
|||||
|
|||||
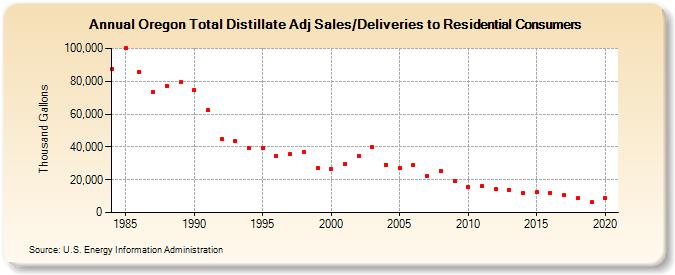
| Oregon Total Distillate Adj Sales/Deliveries to Residential Consumers (Thousand Gallons) | |||||
| Decade | Year-0 | Year-1 | Year-2 | Year-3 | Year-4 | Year-5 | Year-6 | Year-7 | Year-8 | Year-9 |
|---|---|---|---|---|---|---|---|---|---|---|
| 1980's | 87,492 | 99,946 | 85,852 | 73,365 | 77,372 | 79,305 | ||||
| 1990's | 74,738 | 62,454 | 44,875 | 43,476 | 39,140 | 39,591 | 34,491 | 35,371 | 36,999 | 27,061 |
| 2000's | 26,519 | 29,305 | 34,539 | 40,227 | 29,169 | 27,332 | 28,964 | 22,431 | 25,391 | 19,211 |
| 2010's | 15,483 | 16,338 | 14,316 | 13,734 | 11,662 | 12,236 | 12,165 | 10,417 | 8,565 | 6,225 |
| 2020's | 8,765 |
| - = No Data Reported; -- = Not Applicable; NA = Not Available; W = Withheld to avoid disclosure of individual company data. |
| Release Date: 2/9/2022 |
| Next Release Date: Suspended |