|
Download Data (XLS File) |
|
|||||
|
|||||
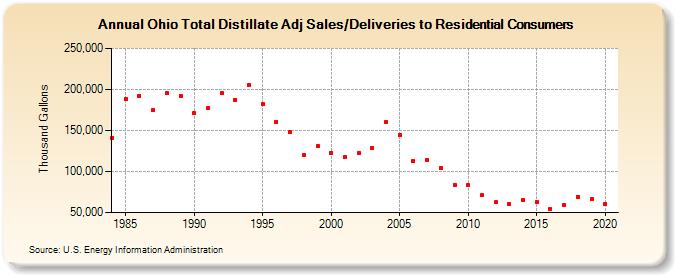
| Ohio Total Distillate Adj Sales/Deliveries to Residential Consumers (Thousand Gallons) | |||||
| Decade | Year-0 | Year-1 | Year-2 | Year-3 | Year-4 | Year-5 | Year-6 | Year-7 | Year-8 | Year-9 |
|---|---|---|---|---|---|---|---|---|---|---|
| 1980's | 141,260 | 188,345 | 192,443 | 174,803 | 195,507 | 192,031 | ||||
| 1990's | 170,927 | 177,219 | 195,871 | 187,711 | 205,280 | 181,673 | 160,908 | 147,915 | 119,569 | 131,252 |
| 2000's | 123,152 | 117,469 | 122,260 | 129,153 | 160,656 | 144,907 | 112,241 | 114,081 | 104,794 | 83,387 |
| 2010's | 83,058 | 70,854 | 62,476 | 60,609 | 64,922 | 62,838 | 54,406 | 59,202 | 69,441 | 66,130 |
| 2020's | 60,432 |
| - = No Data Reported; -- = Not Applicable; NA = Not Available; W = Withheld to avoid disclosure of individual company data. |
| Release Date: 2/9/2022 |
| Next Release Date: Suspended |