|
Download Data (XLS File) |
|
|||||
|
|||||
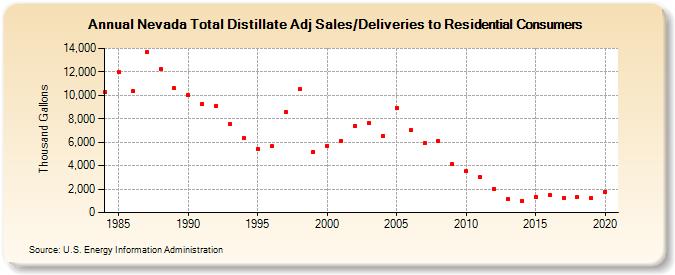
| Nevada Total Distillate Adj Sales/Deliveries to Residential Consumers (Thousand Gallons) | |||||
| Decade | Year-0 | Year-1 | Year-2 | Year-3 | Year-4 | Year-5 | Year-6 | Year-7 | Year-8 | Year-9 |
|---|---|---|---|---|---|---|---|---|---|---|
| 1980's | 10,322 | 11,957 | 10,342 | 13,652 | 12,216 | 10,587 | ||||
| 1990's | 10,003 | 9,291 | 9,109 | 7,518 | 6,325 | 5,459 | 5,674 | 8,586 | 10,550 | 5,170 |
| 2000's | 5,716 | 6,081 | 7,393 | 7,596 | 6,546 | 8,956 | 7,017 | 5,910 | 6,094 | 4,137 |
| 2010's | 3,516 | 2,994 | 2,025 | 1,120 | 1,018 | 1,363 | 1,518 | 1,284 | 1,287 | 1,260 |
| 2020's | 1,779 |
| - = No Data Reported; -- = Not Applicable; NA = Not Available; W = Withheld to avoid disclosure of individual company data. |
| Release Date: 2/9/2022 |
| Next Release Date: Suspended |