|
Download Data (XLS File) |
|
|||||
|
|||||
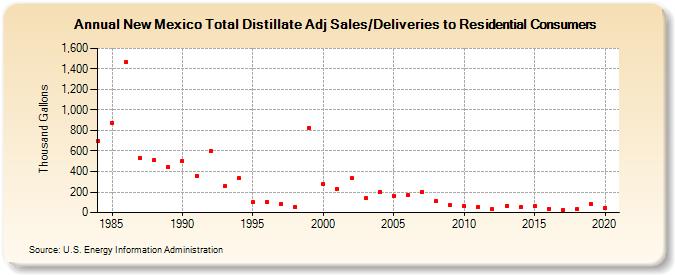
| New Mexico Total Distillate Adj Sales/Deliveries to Residential Consumers (Thousand Gallons) | |||||
| Decade | Year-0 | Year-1 | Year-2 | Year-3 | Year-4 | Year-5 | Year-6 | Year-7 | Year-8 | Year-9 |
|---|---|---|---|---|---|---|---|---|---|---|
| 1980's | 698 | 876 | 1,465 | 533 | 514 | 441 | ||||
| 1990's | 503 | 359 | 602 | 257 | 332 | 100 | 103 | 80 | 57 | 827 |
| 2000's | 277 | 227 | 336 | 138 | 202 | 164 | 168 | 204 | 111 | 69 |
| 2010's | 63 | 53 | 30 | 67 | 53 | 65 | 39 | 21 | 31 | 83 |
| 2020's | 47 |
| - = No Data Reported; -- = Not Applicable; NA = Not Available; W = Withheld to avoid disclosure of individual company data. |
| Release Date: 2/9/2022 |
| Next Release Date: Suspended |