|
Download Data (XLS File) |
|
|||||
|
|||||
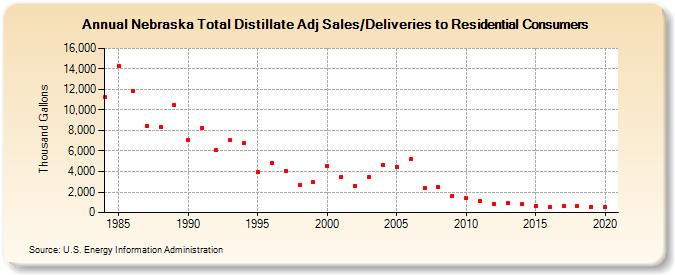
| Nebraska Total Distillate Adj Sales/Deliveries to Residential Consumers (Thousand Gallons) | |||||
| Decade | Year-0 | Year-1 | Year-2 | Year-3 | Year-4 | Year-5 | Year-6 | Year-7 | Year-8 | Year-9 |
|---|---|---|---|---|---|---|---|---|---|---|
| 1980's | 11,232 | 14,328 | 11,862 | 8,467 | 8,355 | 10,456 | ||||
| 1990's | 7,072 | 8,288 | 6,105 | 7,035 | 6,754 | 4,000 | 4,819 | 4,006 | 2,671 | 2,937 |
| 2000's | 4,530 | 3,451 | 2,620 | 3,458 | 4,620 | 4,479 | 5,193 | 2,388 | 2,506 | 1,647 |
| 2010's | 1,379 | 1,086 | 861 | 915 | 814 | 636 | 563 | 645 | 624 | 561 |
| 2020's | 524 |
| - = No Data Reported; -- = Not Applicable; NA = Not Available; W = Withheld to avoid disclosure of individual company data. |
| Release Date: 2/9/2022 |
| Next Release Date: Suspended |