|
Download Data (XLS File) |
|
|||||
|
|||||
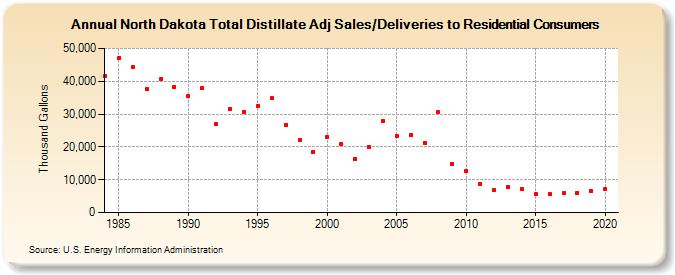
| North Dakota Total Distillate Adj Sales/Deliveries to Residential Consumers (Thousand Gallons) | |||||
| Decade | Year-0 | Year-1 | Year-2 | Year-3 | Year-4 | Year-5 | Year-6 | Year-7 | Year-8 | Year-9 |
|---|---|---|---|---|---|---|---|---|---|---|
| 1980's | 41,467 | 47,112 | 44,336 | 37,603 | 40,530 | 38,339 | ||||
| 1990's | 35,385 | 37,871 | 26,967 | 31,540 | 30,734 | 32,569 | 34,842 | 26,774 | 21,976 | 18,539 |
| 2000's | 23,156 | 20,891 | 16,342 | 19,990 | 27,907 | 23,311 | 23,583 | 21,306 | 30,547 | 14,811 |
| 2010's | 12,726 | 8,754 | 6,813 | 7,922 | 7,163 | 5,699 | 5,655 | 6,032 | 5,975 | 6,513 |
| 2020's | 7,039 |
| - = No Data Reported; -- = Not Applicable; NA = Not Available; W = Withheld to avoid disclosure of individual company data. |
| Release Date: 2/9/2022 |
| Next Release Date: Suspended |