|
Download Data (XLS File) |
|
|||||
|
|||||
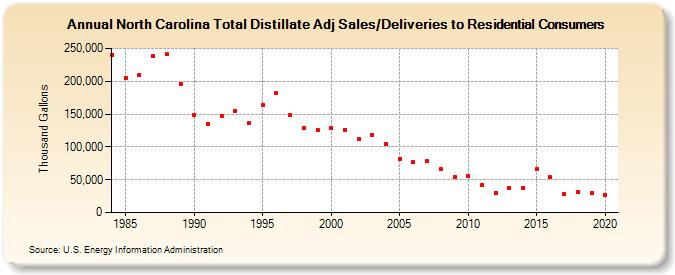
| North Carolina Total Distillate Adj Sales/Deliveries to Residential Consumers (Thousand Gallons) | |||||
| Decade | Year-0 | Year-1 | Year-2 | Year-3 | Year-4 | Year-5 | Year-6 | Year-7 | Year-8 | Year-9 |
|---|---|---|---|---|---|---|---|---|---|---|
| 1980's | 240,142 | 205,416 | 209,081 | 238,714 | 240,830 | 196,372 | ||||
| 1990's | 148,996 | 134,410 | 147,110 | 155,310 | 136,622 | 163,759 | 181,453 | 148,458 | 128,080 | 125,313 |
| 2000's | 128,292 | 126,275 | 112,777 | 118,714 | 104,845 | 81,528 | 76,557 | 78,673 | 66,506 | 54,702 |
| 2010's | 56,332 | 42,024 | 30,282 | 37,389 | 37,190 | 65,882 | 53,847 | 28,469 | 31,463 | 29,430 |
| 2020's | 27,120 |
| - = No Data Reported; -- = Not Applicable; NA = Not Available; W = Withheld to avoid disclosure of individual company data. |
| Release Date: 2/9/2022 |
| Next Release Date: Suspended |