|
Download Data (XLS File) |
|
|||||
|
|||||
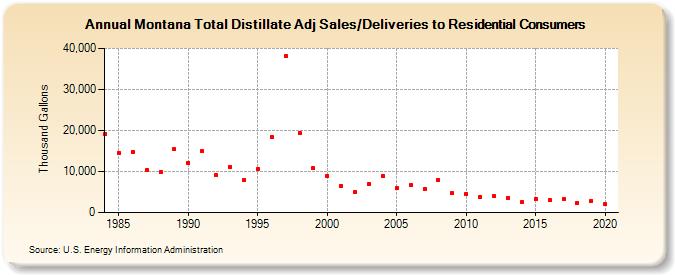
| Montana Total Distillate Adj Sales/Deliveries to Residential Consumers (Thousand Gallons) | |||||
| Decade | Year-0 | Year-1 | Year-2 | Year-3 | Year-4 | Year-5 | Year-6 | Year-7 | Year-8 | Year-9 |
|---|---|---|---|---|---|---|---|---|---|---|
| 1980's | 19,249 | 14,540 | 14,741 | 10,364 | 9,850 | 15,377 | ||||
| 1990's | 12,079 | 14,944 | 9,145 | 11,198 | 7,931 | 10,595 | 18,422 | 38,233 | 19,343 | 10,748 |
| 2000's | 8,951 | 6,494 | 4,949 | 7,040 | 8,923 | 5,975 | 6,664 | 5,702 | 7,938 | 4,716 |
| 2010's | 4,526 | 3,885 | 3,957 | 3,649 | 2,526 | 3,313 | 3,078 | 3,228 | 2,433 | 2,925 |
| 2020's | 1,993 |
| - = No Data Reported; -- = Not Applicable; NA = Not Available; W = Withheld to avoid disclosure of individual company data. |
| Release Date: 2/9/2022 |
| Next Release Date: Suspended |