|
Download Data (XLS File) |
|
|||||
|
|||||
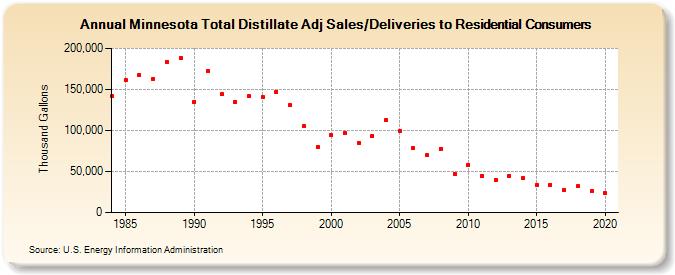
| Minnesota Total Distillate Adj Sales/Deliveries to Residential Consumers (Thousand Gallons) | |||||
| Decade | Year-0 | Year-1 | Year-2 | Year-3 | Year-4 | Year-5 | Year-6 | Year-7 | Year-8 | Year-9 |
|---|---|---|---|---|---|---|---|---|---|---|
| 1980's | 141,842 | 161,073 | 167,864 | 163,249 | 183,729 | 188,737 | ||||
| 1990's | 134,994 | 172,048 | 143,937 | 134,704 | 141,937 | 140,184 | 147,025 | 130,432 | 105,059 | 80,374 |
| 2000's | 94,193 | 97,208 | 85,314 | 93,305 | 112,805 | 99,112 | 78,751 | 70,062 | 77,960 | 47,212 |
| 2010's | 58,302 | 44,759 | 40,020 | 44,697 | 41,509 | 34,064 | 33,923 | 27,728 | 32,008 | 25,679 |
| 2020's | 23,513 |
| - = No Data Reported; -- = Not Applicable; NA = Not Available; W = Withheld to avoid disclosure of individual company data. |
| Release Date: 2/9/2022 |
| Next Release Date: Suspended |