|
Download Data (XLS File) |
|
|||||
|
|||||
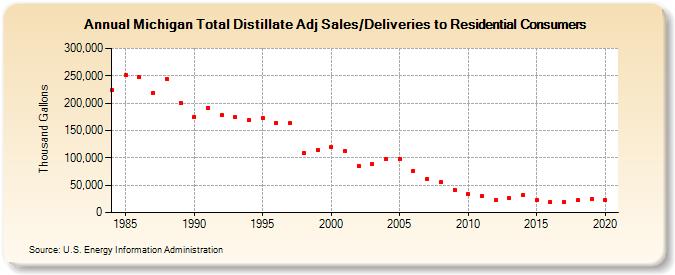
| Michigan Total Distillate Adj Sales/Deliveries to Residential Consumers (Thousand Gallons) | |||||
| Decade | Year-0 | Year-1 | Year-2 | Year-3 | Year-4 | Year-5 | Year-6 | Year-7 | Year-8 | Year-9 |
|---|---|---|---|---|---|---|---|---|---|---|
| 1980's | 223,900 | 251,065 | 247,025 | 219,002 | 244,362 | 200,352 | ||||
| 1990's | 174,589 | 191,368 | 177,823 | 174,122 | 169,100 | 173,335 | 164,389 | 162,886 | 109,667 | 114,503 |
| 2000's | 119,170 | 112,784 | 85,184 | 88,259 | 97,885 | 98,551 | 76,813 | 62,223 | 55,034 | 42,137 |
| 2010's | 33,590 | 30,387 | 22,393 | 25,931 | 32,453 | 22,638 | 19,745 | 19,151 | 22,219 | 24,451 |
| 2020's | 23,286 |
| - = No Data Reported; -- = Not Applicable; NA = Not Available; W = Withheld to avoid disclosure of individual company data. |
| Release Date: 2/9/2022 |
| Next Release Date: Suspended |