|
Download Data (XLS File) |
|
|||||
|
|||||
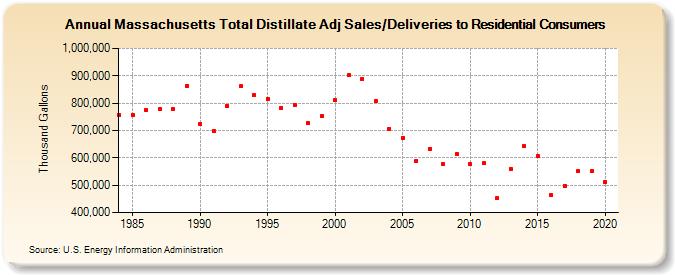
| Massachusetts Total Distillate Adj Sales/Deliveries to Residential Consumers (Thousand Gallons) | |||||
| Decade | Year-0 | Year-1 | Year-2 | Year-3 | Year-4 | Year-5 | Year-6 | Year-7 | Year-8 | Year-9 |
|---|---|---|---|---|---|---|---|---|---|---|
| 1980's | 755,594 | 756,390 | 776,428 | 780,180 | 778,311 | 862,166 | ||||
| 1990's | 724,299 | 698,653 | 790,410 | 861,491 | 828,893 | 816,733 | 782,640 | 794,329 | 726,585 | 752,643 |
| 2000's | 810,055 | 902,769 | 886,347 | 808,297 | 706,874 | 674,324 | 589,974 | 633,567 | 576,182 | 614,379 |
| 2010's | 577,374 | 579,401 | 453,191 | 560,830 | 641,885 | 606,641 | 464,092 | 498,444 | 550,944 | 550,302 |
| 2020's | 512,418 |
| - = No Data Reported; -- = Not Applicable; NA = Not Available; W = Withheld to avoid disclosure of individual company data. |
| Release Date: 2/9/2022 |
| Next Release Date: Suspended |