|
Download Data (XLS File) |
|
|||||
|
|||||
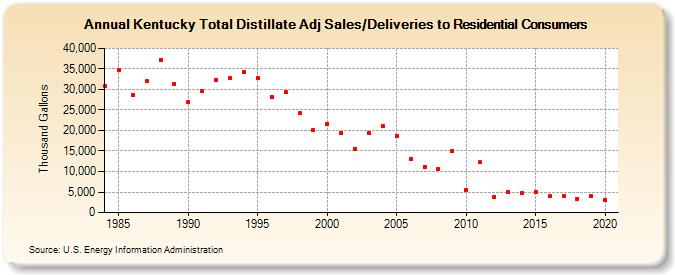
| Kentucky Total Distillate Adj Sales/Deliveries to Residential Consumers (Thousand Gallons) | |||||
| Decade | Year-0 | Year-1 | Year-2 | Year-3 | Year-4 | Year-5 | Year-6 | Year-7 | Year-8 | Year-9 |
|---|---|---|---|---|---|---|---|---|---|---|
| 1980's | 30,766 | 34,702 | 28,656 | 31,939 | 37,255 | 31,287 | ||||
| 1990's | 26,989 | 29,525 | 32,298 | 32,691 | 34,239 | 32,835 | 28,220 | 29,257 | 24,176 | 20,008 |
| 2000's | 21,650 | 19,392 | 15,604 | 19,332 | 21,111 | 18,736 | 13,014 | 11,132 | 10,523 | 14,882 |
| 2010's | 5,615 | 12,257 | 3,911 | 4,902 | 4,664 | 4,907 | 3,996 | 4,033 | 3,396 | 3,986 |
| 2020's | 3,138 |
| - = No Data Reported; -- = Not Applicable; NA = Not Available; W = Withheld to avoid disclosure of individual company data. |
| Release Date: 2/9/2022 |
| Next Release Date: Suspended |