|
Download Data (XLS File) |
|
|||||
|
|||||
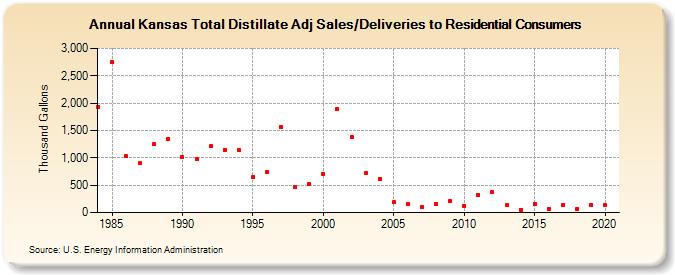
| Kansas Total Distillate Adj Sales/Deliveries to Residential Consumers (Thousand Gallons) | |||||
| Decade | Year-0 | Year-1 | Year-2 | Year-3 | Year-4 | Year-5 | Year-6 | Year-7 | Year-8 | Year-9 |
|---|---|---|---|---|---|---|---|---|---|---|
| 1980's | 1,929 | 2,752 | 1,028 | 897 | 1,254 | 1,345 | ||||
| 1990's | 1,013 | 982 | 1,211 | 1,145 | 1,139 | 649 | 740 | 1,572 | 472 | 529 |
| 2000's | 700 | 1,889 | 1,381 | 714 | 615 | 185 | 152 | 104 | 163 | 203 |
| 2010's | 127 | 327 | 379 | 133 | 52 | 158 | 61 | 143 | 74 | 141 |
| 2020's | 130 |
| - = No Data Reported; -- = Not Applicable; NA = Not Available; W = Withheld to avoid disclosure of individual company data. |
| Release Date: 2/9/2022 |
| Next Release Date: Suspended |