|
Download Data (XLS File) |
|
|||||
|
|||||
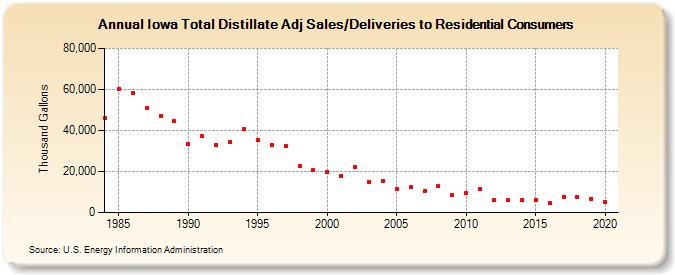
| Iowa Total Distillate Adj Sales/Deliveries to Residential Consumers (Thousand Gallons) | |||||
| Decade | Year-0 | Year-1 | Year-2 | Year-3 | Year-4 | Year-5 | Year-6 | Year-7 | Year-8 | Year-9 |
|---|---|---|---|---|---|---|---|---|---|---|
| 1980's | 45,932 | 60,396 | 58,268 | 51,164 | 46,844 | 44,732 | ||||
| 1990's | 33,376 | 37,232 | 32,711 | 34,451 | 40,817 | 35,476 | 32,976 | 32,232 | 22,736 | 20,531 |
| 2000's | 19,767 | 17,621 | 22,341 | 15,035 | 15,435 | 11,465 | 12,317 | 10,395 | 13,024 | 8,447 |
| 2010's | 9,520 | 11,450 | 6,248 | 5,930 | 6,229 | 5,994 | 4,640 | 7,476 | 7,352 | 6,751 |
| 2020's | 5,306 |
| - = No Data Reported; -- = Not Applicable; NA = Not Available; W = Withheld to avoid disclosure of individual company data. |
| Release Date: 2/9/2022 |
| Next Release Date: Suspended |