|
Download Data (XLS File) |
|
|||||
|
|||||
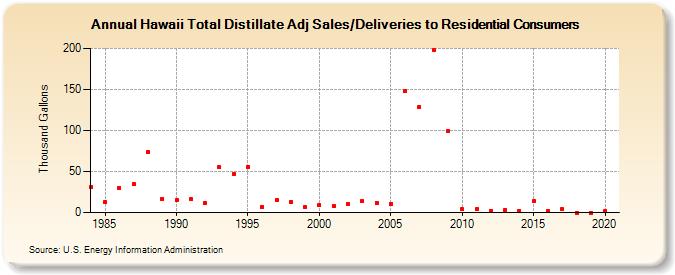
| Hawaii Total Distillate Adj Sales/Deliveries to Residential Consumers (Thousand Gallons) | |||||
| Decade | Year-0 | Year-1 | Year-2 | Year-3 | Year-4 | Year-5 | Year-6 | Year-7 | Year-8 | Year-9 |
|---|---|---|---|---|---|---|---|---|---|---|
| 1980's | 31 | 13 | 30 | 35 | 74 | 17 | ||||
| 1990's | 15 | 16 | 12 | 55 | 47 | 56 | 7 | 15 | 13 | 7 |
| 2000's | 9 | 8 | 10 | 14 | 12 | 11 | 148 | 129 | 198 | 99 |
| 2010's | 4 | 4 | 2 | 3 | 2 | 14 | 2 | 4 | 0 | 0 |
| 2020's | 2 |
| - = No Data Reported; -- = Not Applicable; NA = Not Available; W = Withheld to avoid disclosure of individual company data. |
| Release Date: 2/9/2022 |
| Next Release Date: Suspended |