|
Download Data (XLS File) |
|
|||||
|
|||||
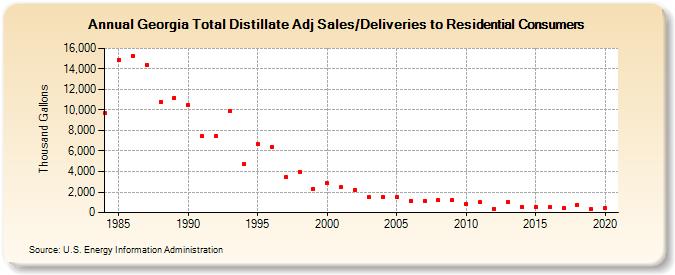
| Georgia Total Distillate Adj Sales/Deliveries to Residential Consumers (Thousand Gallons) | |||||
| Decade | Year-0 | Year-1 | Year-2 | Year-3 | Year-4 | Year-5 | Year-6 | Year-7 | Year-8 | Year-9 |
|---|---|---|---|---|---|---|---|---|---|---|
| 1980's | 9,672 | 14,881 | 15,290 | 14,393 | 10,821 | 11,208 | ||||
| 1990's | 10,465 | 7,494 | 7,460 | 9,885 | 4,727 | 6,677 | 6,430 | 3,423 | 4,001 | 2,309 |
| 2000's | 2,836 | 2,462 | 2,209 | 1,501 | 1,472 | 1,520 | 1,157 | 1,128 | 1,182 | 1,188 |
| 2010's | 839 | 997 | 374 | 1,008 | 560 | 496 | 565 | 433 | 751 | 309 |
| 2020's | 426 |
| - = No Data Reported; -- = Not Applicable; NA = Not Available; W = Withheld to avoid disclosure of individual company data. |
| Release Date: 2/9/2022 |
| Next Release Date: Suspended |