|
Download Data (XLS File) |
|
|||||
|
|||||
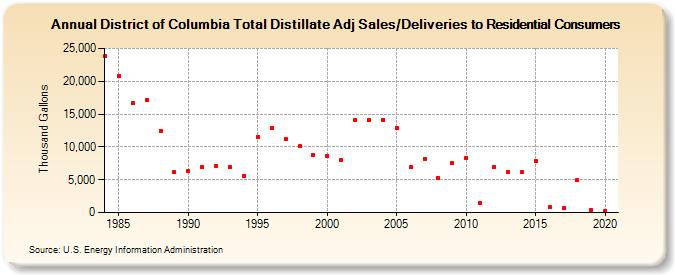
| District of Columbia Total Distillate Adj Sales/Deliveries to Residential Consumers (Thousand Gallons) | |||||
| Decade | Year-0 | Year-1 | Year-2 | Year-3 | Year-4 | Year-5 | Year-6 | Year-7 | Year-8 | Year-9 |
|---|---|---|---|---|---|---|---|---|---|---|
| 1980's | 23,838 | 20,856 | 16,728 | 17,187 | 12,392 | 6,115 | ||||
| 1990's | 6,261 | 6,931 | 7,137 | 6,897 | 5,594 | 11,575 | 12,879 | 11,184 | 10,065 | 8,811 |
| 2000's | 8,633 | 8,062 | 14,133 | 14,069 | 14,144 | 12,832 | 6,892 | 8,172 | 5,257 | 7,576 |
| 2010's | 8,316 | 1,455 | 6,997 | 6,223 | 6,138 | 7,818 | 778 | 643 | 4,889 | 370 |
| 2020's | 299 |
| - = No Data Reported; -- = Not Applicable; NA = Not Available; W = Withheld to avoid disclosure of individual company data. |
| Release Date: 2/9/2022 |
| Next Release Date: Suspended |