|
Download Data (XLS File) |
|
|||||
|
|||||
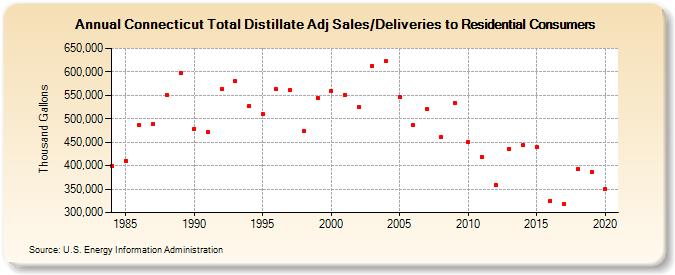
| Connecticut Total Distillate Adj Sales/Deliveries to Residential Consumers (Thousand Gallons) | |||||
| Decade | Year-0 | Year-1 | Year-2 | Year-3 | Year-4 | Year-5 | Year-6 | Year-7 | Year-8 | Year-9 |
|---|---|---|---|---|---|---|---|---|---|---|
| 1980's | 399,801 | 410,776 | 486,135 | 487,757 | 551,570 | 597,477 | ||||
| 1990's | 478,734 | 471,740 | 564,445 | 579,658 | 526,930 | 509,969 | 562,736 | 561,107 | 473,268 | 544,912 |
| 2000's | 559,567 | 550,854 | 525,990 | 612,107 | 622,204 | 545,910 | 486,255 | 520,078 | 460,374 | 534,609 |
| 2010's | 450,870 | 418,371 | 359,694 | 436,008 | 443,233 | 440,238 | 325,189 | 317,648 | 392,859 | 386,266 |
| 2020's | 349,714 |
| - = No Data Reported; -- = Not Applicable; NA = Not Available; W = Withheld to avoid disclosure of individual company data. |
| Release Date: 2/9/2022 |
| Next Release Date: Suspended |