|
Download Data (XLS File) |
|
|||||
|
|||||
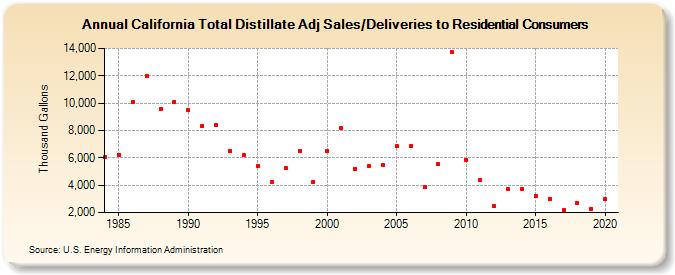
| California Total Distillate Adj Sales/Deliveries to Residential Consumers (Thousand Gallons) | |||||
| Decade | Year-0 | Year-1 | Year-2 | Year-3 | Year-4 | Year-5 | Year-6 | Year-7 | Year-8 | Year-9 |
|---|---|---|---|---|---|---|---|---|---|---|
| 1980's | 6,026 | 6,234 | 10,059 | 11,983 | 9,580 | 10,108 | ||||
| 1990's | 9,466 | 8,359 | 8,425 | 6,493 | 6,212 | 5,433 | 4,227 | 5,245 | 6,534 | 4,254 |
| 2000's | 6,507 | 8,169 | 5,219 | 5,387 | 5,470 | 6,836 | 6,841 | 3,853 | 5,540 | 13,704 |
| 2010's | 5,842 | 4,395 | 2,491 | 3,698 | 3,754 | 3,206 | 3,018 | 2,189 | 2,674 | 2,273 |
| 2020's | 2,955 |
| - = No Data Reported; -- = Not Applicable; NA = Not Available; W = Withheld to avoid disclosure of individual company data. |
| Release Date: 2/9/2022 |
| Next Release Date: Suspended |