|
Download Data (XLS File) |
|
|||||
|
|||||
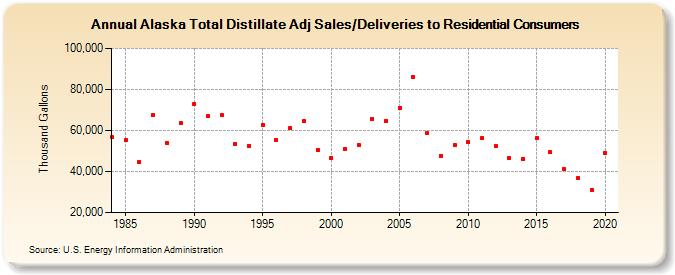
| Alaska Total Distillate Adj Sales/Deliveries to Residential Consumers (Thousand Gallons) | |||||
| Decade | Year-0 | Year-1 | Year-2 | Year-3 | Year-4 | Year-5 | Year-6 | Year-7 | Year-8 | Year-9 |
|---|---|---|---|---|---|---|---|---|---|---|
| 1980's | 56,604 | 55,151 | 44,716 | 67,769 | 53,971 | 63,744 | ||||
| 1990's | 73,117 | 67,043 | 67,459 | 53,601 | 52,604 | 62,800 | 55,141 | 61,023 | 64,704 | 50,511 |
| 2000's | 46,722 | 50,763 | 53,023 | 65,750 | 64,743 | 71,069 | 86,192 | 58,627 | 47,624 | 52,849 |
| 2010's | 54,342 | 56,263 | 52,662 | 46,396 | 46,013 | 56,201 | 49,271 | 41,249 | 36,808 | 31,136 |
| 2020's | 49,149 |
| - = No Data Reported; -- = Not Applicable; NA = Not Available; W = Withheld to avoid disclosure of individual company data. |
| Release Date: 2/9/2022 |
| Next Release Date: Suspended |